Prevalence of Lean Steatotic Liver Disease in Type 2 DM and Association of Fibrosis With Metabolic Syndrome
Karki N*, Sudhamshu KC and Sharma D
Department of Hepatology, Bir Hospital, Nepal
Submission:March 04, 2025;Published:March 25, 2025
*Corresponding author:Karki N, Department of Hepatology, Bir Hospital, Kathmandu, Nepal
How to cite this article:Karki N, Sudhamshu K, Sharma D. Prevalence of Lean Steatotic Liver Disease in Type 2 DM and Association of Fibrosis With Metabolic Syndrome. Adv Res Gastroentero Hepatol, 2025; 21(4): 556068.DOI: 10.19080/ARGH.2025.21.556068.
Abstract
Introduction: Fatty liver is globally prevalent liver disease among obese as well as in lean group with various outcomes from steatohepatitis to cirrhosis, hepatocellular carcinoma and even death. MetS has increased risk of hepatic steatosis and fibrosis than subjects without MetS. MetS is an independent risk factor for hepatic fibrosis in obese NAFLD as well as in lean NAFLD even in the absence of metabolic syndrome.
Objectives : This study will help to identify the burden of fatty liver disease in lean group in our community, its association with metabolic syndrome and relation of metabolic syndrome with fibrosis.
Methods: It was the hospital based observational study done in bir hospital from mid of 2015 for one year period. 54 patients newly diagnosed or with H/O DM who met the inclusion criteria were recruited for the study. Patients were categorized as obese and non-obese according to Asian BMI. Routine blood investigations were done. Fatty liver and its severity were assessed by USG. Metabolic syndrome was assessed in both the group All patients with fatty liver were subjected to fibro scan. NAFLD fibrosis score, BARD score and FIB4 score was calculated by using the standard formula from website and was compared with fibro scan. Association of metabolic syndrome with steatosis and fibrosis of liver is assessed.
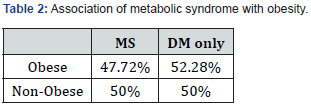
Results: Total cases of study were 54 of which 30(55.6%) were male and 24(44.6%) were female. Mean age of the patient was 49.5 with minimum of 27 years and maximum of 86 years with SD(11.588). Among the studied group 18.1% were non obese and 81.9% were categorized as Obese applying Asian BMI chart .Metabolic syndrome was associated with half of the lean NAFLD, and isolated DM was also linked in the half of the case. Among the obese group association of isolated DM was marginally higher i.e., 52.28% than metabolic syndrome being 47.72% . Severe fatty liver is common in BMI of > 27.5. And not a single case of severe fatty liver was detected in patients with Normal BMI group. Met. The mean of different fibrosis scores is slightly higher in patients with metabolic syndrome than without metabolic syndrome being NAF FIB score- 1.93, BARD score-2.88, FIB4 score-1.72 and fibro scan score-6.68 with insignificant P values.
Conclusion: Fatty liver is globally prevalent liver disease among obese as well as in lean group with various outcomes from steatohepatitis to cirrhosis, hepatocellular carcinoma and even death. Metabolic syndrome has increased risk of hepatic steatosis and fibrosis. Metabolic syndrome is an independent risk factor for hepatic steatosis and fibrosis in obese NAFLD as well as in lean NAFLD.
Keywords:NAFLD(Non-alcoholic fatty liver disease; MetS(Metabolic syndrome); BMI(Body mass index)
Abbreviations:NAFLD: Non-Alcoholic Fatty Liver Disease; MetS: Metabolic Syndrome; BMI: Body Mass Index; NAFL: Non-Alcoholic Fatty Liver; NASH: Non-Alcoholic Steatohepatitis; CVD: Cardiovascular Disease
Introduction
Non-alcoholic fatty liver disease (NAFLD) is a major cause of chronic liver disease. It encompasses a spectrum of clinical-histological phenotypes from non-alcoholic fatty liver (NAFL) to non-alcoholic steatohepatitis (NASH) which can progress to cirrhosis. Although obesity plays the most pivotal role in NAFLD, approximately 10–20% of individuals with NAFLD who are not overweight or obese (BMI < 25kg/m2, or BMI < 23kg/m2 in Asians) have “lean NAFLD.” Lean individuals with NAFLD have a lower prevalence of diabetes, hypertension, hypertriglyceridemia, central obesity, and metabolic syndrome than non-lean individuals with NAFLD, but higher fibrosis scores and rates of cardiovascular morbidity and all-cause mortality in advanced stages [1]. Excess body weight, type 2 diabetes and dyslipidaemia are classic risk factors for NAFLD. Although, it is now recognised that the condition exists in those who are not obese, especially in Asia . According to the latest research, the global prevalence of lean and non-obese NAFLD was approximately 5.1% and 12.1% , respectively and the lean NAFLD is commonly found in Asia. Although having similar complications with obese NAFLD, lean NAFLD is increasingly viewed as a significant phenotype, which showed different risk for these complications like type 2 diabetes (T2DM) and cardiovascular disease (CVD) [2-5] . In recent years, accumulating evidence have demonstrated that lean NAFLD is a progressive condition, and patients with lean NAFLD exhibited some features of Metabolic syndrome and might have worse outcomes than obese counterparts.
The combination of T2DM and MASLD also significantly increases the risk of non-liver related morbidity and mortality, and cardiovascular disease and non-liver malignancy remains the leading causes of death in patients with MASLD, ahead of liver-related mortality, in those with and without T2DM. Patients with T2DM and MASLD have an increased risk of cardiovascular disease (CVD), arrhythmia and chronic kidney disease progression compared with those without MASLD. Patients with MASLD and T2DM have a higher likelihood of progressive fibrosis and faster rate of fibrosis progression than those without .As a result, more individuals progress to liver cirrhosis, cirrhosis decompensation and have a higher risk of liver-related mortality [6]. The study was conducted from the mid of2015 for about 1 year period in the Liver Unit, NAMS, Bir Hospital, Nepal. The study was designed as a hospital based observational study [7,8]. 54 patients newly diagnosed or with H/O DM coming to Liver and Endocrine OPD within this period who met the criteria and gave the consent, were recruited for the study. Complete general and systemic examination including anthropometry was done. Patients were categorized as obese and non-obese according to Asian BMI. Routine blood investigations were done. Fatty liver and its severity were assessed by USG. All patients with fatty liver were subjected to fibro scan [9]. NAFLD fibrosis score, BARD score and FIB4 score was calculated by using the standard formula from website and was compared with fibro can. NAFLD Fibrosis score was calculated from the values obtained by using formula 1.675 + 0.037 × age (years) + 0.094 × BMI (kg/m2) + 1.13 × IFG/diabetes (yes = 1, no = 0) + 0.99 × AST/ALT ratio – 0.013 × platelet (×109/l) – 0.66 × albumin (g/dl). NAFLD Score < -1.455 = F0-F2,NAFLD Score -1.455 – 0.675 = indeterminate score, NAFLD Score > 0.675 = F3-F4. BARD score composed of 3 variables: AST/ALT ratio ≥0.8–2 points; a BMI ≥28 – 1 point; and the presence of diabetes – 1 point [10-12].
The possible score ranges from 0 to 4 points. BMI ≥ 28 kg/m2 = 1 point, BMI <28 kg/m2 = 0 point; AST/ALT ratio ≥ 0.8 = 2 points, AST/ALT ratio < 0.8 = 0 points; freshly recognized or preexisting DMT2 = 1 point. A total of 2-4 points (sum of the score of BMI, AST/ ALT ratio and presence or absence of DMt2) indicate significant fibrosis. FIB 4 score was also calculated by using standard formula including variables of age, AST,ALT and platelets. Using a lower cutoff value of 1.45, a FIB4 score<1.45 had a negative predictive value of 90% for advanced fibrosis .In contrast a FIB4 score of>3.25 would have a 97% specificity and a positive predictive value of 65% for advanced fibrosis. AST/ALT ratio and level of platelets were correlated with the severity of fibrosis score [13- 15]. Calculation of sample size: Formula: N= (Za2) (P) (Q)/d2, Where, N=required sample size, Za=Variate corresponding to desired reliability level (1.96 for 95% reliability) P=Estimated proportion in the population (14.5% for this study). Q=100-P (if P is in %). d=Maximum tolerable error (10%).N=1.962 * 14.5* 60/102 =48.54 were collected for this study. Mean values, standard deviations, minimums and maximums were used to indicate the quantitative variables. The characteristics of NAFLD patients and the risk of estimates for association with each characteristic were verified by using Pearson Chi-square test.
Results
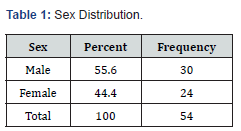
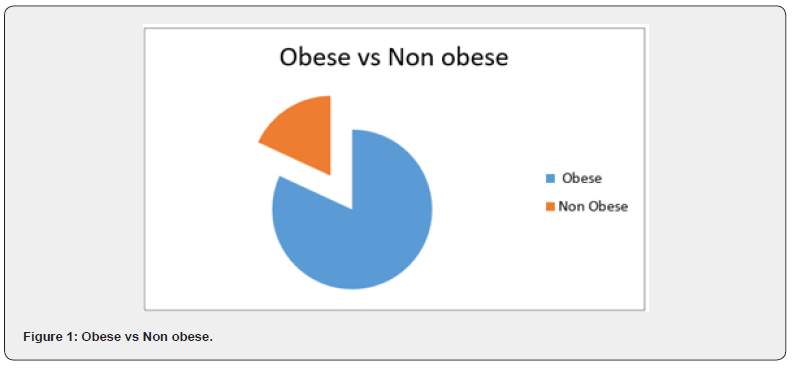
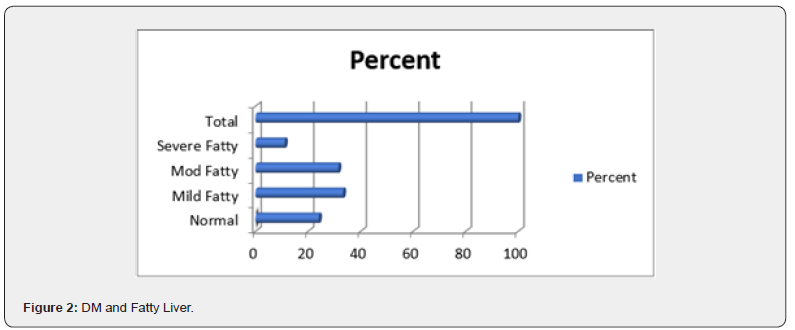
(Table 1) Total cases of study were 54 of which 30(55.6%) were male and 24(44.6%) were female. Mean age of the patient was 49.5 with minimum of 27 years and maximum of 86 years with SD(11.588).Most of the patients i.e., 36(66.7%) fall in 41-60 years group followed by 10(18.5%) in <40 years and 8(14.8%) in >60 years age group . (Figure 1) Among the studied group most of the patients i.e. 44 out 0f 54 (i.e., 81.9%) fall in obese group with BMI more than 23 and least patients 10(18.1%) had BMI of 23 or less fall into lean NAFLD group applying Asian BMI chart. (Figure 2) Among the total patients, about 24.1% had normal liver with 75.9% having fatty liver among which18(33.3%) had mild fatty liver,17(31.5%) had moderate fatty liver and 6(11.1%) had severe fatty liver. Severe fatty liver is common in BMI of > 27.5 and not a single case of severe fatty liver was detected in lean group.


(Table 2) It was found that metabolic syndrome was associated with 50% of non-obese NAFLD and 47.2% of Obese NAFLD. Isolated DM was seen in 52.28% of obese group and 50% of Non-obese group. (Table 3) The mean of different fibrosis scores is slightly higher in patients with metabolic syndrome than without metabolic syndrome being NAF FIB score- 1.93, BARD score-2.88, FIB4 score-1.72 and fibro scan score-6.68 with insignificant P values. The minimum AST/ALT ratio noted is 0.41 and maximum is 0.96 with mean of 2.28. And minimum platelets count noted is 20900/cm and maximum 199000 with mean of 57000/cm (Table 4). Low platelets count is associated with high NAF FIB score and FIB4 score with significant P values of <0.001 whereas high AST/ ALT ratio correlates only with BARD score with significant P value.


Discussion
Total cases of study were 54 of which 30(55.6%) were male and 24(44.6%) were female. Mean age of the patient was 49.5 with minimum of 27years and maximum of 86 years with SD(11.588).Most of the patients i.e., 36(66.7%) fall in 41-60 years group followed by 10(18.5%) in <40 years and 8(14.8%) in >60 years age group. Worldwide, NAFLD has a reported prevalence of 6 to 35 percent (median 20 percent).In the developing world also the incidence of NAFLD is increasing accounting5 to 30 percent 23 which is rather slightly higher than the study done by Amrapurkar DN et al., Vernon G et al 25 showed that most patients are diagnosed with NAFLD in their 40s or 50s with male preponderance which is similar to our study. Among the total patients, 18(33.3%) had mild fatty liver,17(31.5%) had moderate fatty liver and 6(11.1%) had severe fatty liver. About 24.1% had Normal liver. More the duration of DM, the severity of fatty liver is increased. Among the studied group most of the patients i.e., 23(42.59%) falls in very obese group and least patients 11(20.37%) fall in normal group and severe fatty liver is common in BMI of > 27.5. And not a single case of severe fatty liver detected in patients with Normal BMI group. Rui Fan et al in their study showed that when BMI <23 kg/ m2, BMI had no effect on the risk of fatty liver, and when BMI >23 kg/m2, the risk of fatty liver disease increased significantly with a 1 kg/m2 increase in BMI indicating higher the BMI more chances of having fatty liver as shown in our study.
The magnitude and consistency of the associations, namely a 5- to 10-fold increased risk in the obese and 10- to 14-fold risk in the morbidly obese highlights the importance of both prevention of weight gain and weight reduction strategies in the prevention and management of NAFLD. A recent meta-analysis of NAFLD reported that the degree of metabolic dysfunction was weight-dependent, with significantly less metabolic dysfunction in lean subjects compared with their overweight counterparts. which is contrary to our study showing almost equal contribution of metabolic syndrome or isolated DM in the fatty liver in both the group. In our study, the mean of different fibrosis scores is slightly higher in patients with metabolic syndrome than without metabolic syndrome being NAF FIB score- 1.93, BARD score-2.88, FIB4 score-1.72 and fibro scan score-6.68 with insignificant P values. The mean of different fibrosis scores is slightly higher in patients with metabolic syndrome than without metabolic syndrome which is similar to the study done by Zhiming Huang et al showing LSM measured by transient elastography had a strong correlation with the clustering of metabolic syndrome components in NAFLD even in patients with long-standing type 2 diabetes. This study has shown that the combination of Fibro scan and AST/ALT, APRI, and FIB-4 methods provides a valuable approach for assessing liver fibrosis in NAFLD patients.
Conclusion
Though Steatotic liver disease is common in obese patients, it is also emerging in the lean group. The severity of fatty liver directly correlates with the grade of obesity. There is as such no difference in the linkage of metabolic syndrome and isolated DM with obesity. The fibrosis scores as assessed by different non-invasive methods was slightly higher in patients with metabolic syndrome.
References
- Sattar N, Forrest E, Preiss D (2014) Non-alcoholic fatty liver disease. BMJ 349: g4596.
- Ruohui X, Jiashu P Wenjun J (2022) Recent advances in lean NAFLD. Biomedicine and Pharmacotherapy 153: 113331.
- Younossi Z, Anstee QM, Marietti M, Hardy T, Henry L (2018) Global burden of NAFLD and NASH: trends, predictions, risk factors and prevention. Nat Rev Gastroenterol Hepatol 15: 11-20.
- Dong HS, Kang D, Cho SJ, Paik S, Gwak GY (2019) Lean non-alcoholic fatty liver disease and development of diabetes: A cohort study. Eur J Endocrinol 181: 2.
- Golabi P (2019) Patients with lean non-alcoholic fatty liver disease are metabolically abnormal and have a higher risk for mortality. Clin Diabet 37: 65-72.
- Lonardo A, Ballestri S, Marchesini G, Angulo P, Loria P (2015) Non-alcoholic fatty liver disease: A precursor of the metabolic syndrome. Dig Liver Dis 47: 181-190.
- Dongiovanni P (2018) Causal relationship of hepatic fat with liver damage and insulin resistance in nonalcoholic fatty liver. J Intern Med 283: 356-370.
- Byrne CD, Targher G (2015) NAFLD: A multisystem disease. J Hepatol 62(Suppl1): S47-64.
- Chung GE, Jeong SM, Cho EJ (2022) The association of fatty liver index and BARD score with all-cause and cause-specific mortality in patients with type 2 diabetes mellitus: A nationwide population-based study. Cardiovasc Diabetol 21: 273.
- Huang DQ, Wilson LA, Behling C (2023) Fibrosis progression rate in biopsy-proven non-alcoholic fatty liver disease among people with diabetes versus people without diabetes: A multicentre study. Gastroenterology 165: 463-472.
- Rui Fan, Jufang W, Jinman D (2018) Association between body mass index and fatty liver risk: A dose-response analysis. Scientific reports 8(15273).
- Katrina L, Shaum K, David P (2016) Body Mass Index and Risk of Nonalcoholic Fatty Liver Disease. J Clin Endocrinol Metab 101(3): 945-952.
- Tang A, Ng CH, Phang PH, Chan KE, Chin YH (2022) Comparative burden of metabolic dysfunction in lean NAFLD vs Non-lean NAFLD - A systematic review and meta-analysis. Clin Gastroenterol Hepatol 21(7):1750-1760.e12.
- Zhiming H, Chi Ho Lee, Ho Hi Fong, Karen S Lam (2018) Association between Metabolic Syndrome Components and Indices of Liver Steatosis and Stiffness by Transient Elastography in Patients with Type 2 Diabetes and Imaging-Confirmed Non-alcoholic Fatty Liver Diseas Diabetes 67(Suppl 1): 617-617.
- Hind I Fallatah, Hisham O, Akbar AM (2016) Fibroscan Compared to FIB-4, APRI, and AST/ALT Ratio for Assessment of Liver Fibrosis in Saudi Patients with Non-alcoholic Fatty Liver Disease. Official Journal of Research Centre for Gastroenterology and Liver Diseases 16(7): e38346.


